COVeRTM is a
stand-alone
application for the visualization of thermal model results.
Its
most powerful feature is the ability to display heat flows between
groups in a block diagram format, which allows the analyst to verify
the heat flows shown in the model against the intended design.
Furthermore, the ability to compare flight heat flows with
those
in a test model can help to identify shortcomings in a test setup
COVeRTM
Main Interface
COVeR first creates a data storage file with the data
requested by the user from the output file
- .cvr file can be re-used if the output
data is unchanged
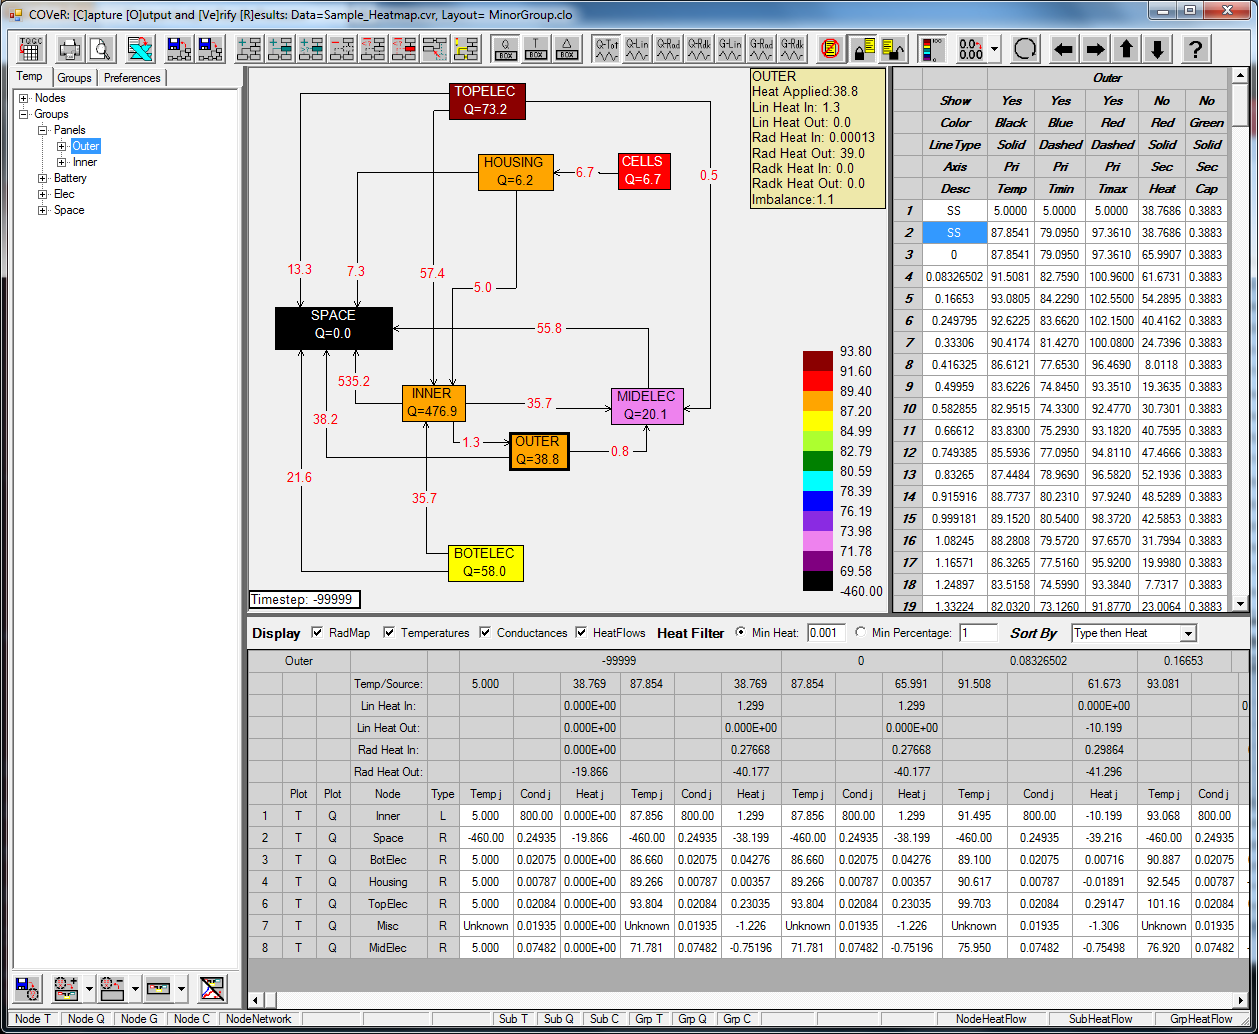
The COVeR interface features 4 panels for the selection and
visualization of results:
- Navigation Tree
- Graphics Window
- Plot Data Grid
- HeatFlow Data Grid
The Graphics Window can display either:
- Transient Plots
- Graphical HeatMaps
ToolBar at the top allows for control over various aspects
of the Graphical Heatmaps
The Graphical HeatMap ColorBar provides temperature
information while text provide dissipations
Layouts of Graphical HeatMaps can be saved and loaded
StatusBar at the bottom indicates the available data and
progress of calculations
Images of Graphics Window and Plot/HeatFlow data can be
copied to Clipboard