- Thermal Analysis Results Processor
Post-processing...Yeah, we've
got that covered
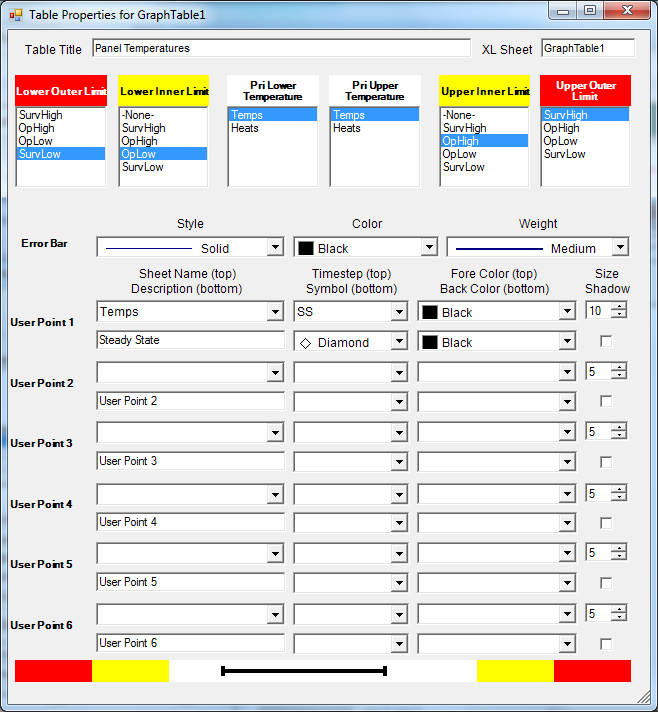
The Graphical Table Properties form allows the user to specify the Outer and Inner limits and sheets for predictions. The data range is represented as an error bar between yellow and red horizontal bar graphs to display the predicted range with respect to limits. The user may also add up to six discrete data points to idnetify further information (such as qualification temperature or non-operational predictions)